


People don't understand what analytics is. Especially in marketing. Hoping to increase the value of the work, they call analytics reports and statistical calculations, which is usually ignored by the customer, and the impression of "analysis" is formed by the number of pages of the document.
The thing is that there is always a lot of data based on which the analysis is built. So, some simple groupings are often considered as analytics. In fact, data separate from the objectives are of little value.
A Report Isn’t an Analysis
There is a fundamental difference between a report and an analysis:
| Report | Analysis |
| Provides data | Provides answers and/or recommendations |
| Provides requested data | Provides necessary data |
| Standardized | Flexible, adapts to the solution of a problem |
| Can often be generated automatically | Difficult to automate |
| Reveal the past | Reveal the future while considering the past and present |
Any analysis begins with the formation and research of key indicators and the correlations between them. Substitution of concepts: goal setting is often referred to as analytics, although it is not.
Sometimes the expert opinion of a person is claimed to be the data for conclusions. There are a couple of things to be clarified:
- Expert is a recognition of competence in the professional sphere. If the expert has it, their opinion can be a basis for some analytical statements. Otherwise, you should rely on statistically significant research of your company or companies that conduct such research, such as TNS, Google, Yandex, Facebook and others.
- Updating data, especially in marketing, is the key, as conclusions based on outdated information cannot be true.
Procedure of Forming the Analysis
Formation of KPI → Formation of task to change KPI → Formation and collection of data → Conclusions based on data → Recommendations on what exactly should be done to change KPI → Implementation of changes → Retrospective.
Formation of task to change KPI
The business dictates plans to increase revenue. Marketing converts these objectives into plans for orders, traffic and then assigns them to an agency or contractor. At this stage, the correctness of goal setting constantly suffers at this stage due to high ambitions and limited resources. The eternal problem of mankind is to get as much as possible by spending as little as possible. In general, there is nothing wrong with this, but before accepting the task an experienced analyst always evaluates how adequate the requirements are before the task will be accepted.
As an example, let's analyze a typical task: "Formulate and justify hypotheses to increase the average check on sales of service cards for corporate clients". The mistake of this setting is that the solutions that the analyst was working out were not suitable for the current customers. Failing to say that we were only interested in new customers gave us inappropriate hypotheses.
Formation and collection of data
Goals in Google Analytics, call tracking, period transaction report, consumer behavior statistics – the collection of this information should be set up in advance, preferably centrally, for quick and easy access to different slices of data.
Conclusions and recommendations
Having statistically significant inferences, we can generate recommendations for changes. The objective of this stage is to indicate specific steps that can be taken to use the results of the analysis to improve the business.
Imagine you have two hypotheses based on the results of your analysis:
- With a probability of 99%, action A will increase sales by 5% per year. The cost of implementation is 10% of annual turnover.
- With a probability of 50% action B will increase sales by 30% per year. The cost of implementation is 5% of annual turnover.
Which solution would you choose, other things being equal?
Retrospective
The analyst is responsible ̶t̶o̶ ̶G̶o̶d̶,̶ ̶s̶h̶o̶u̶l̶d̶ ̶s̶t̶a̶k̶e̶ ̶l̶i̶f̶e̶ ̶a̶n̶d̶ ̶s̶a̶l̶a̶r̶y̶ for the quality of the analysis, just like any professional. The retrospective should show which hypotheses worked out and what deviation from targets actually occurred. As well as why these deviations occurred and what should be done in the future.
I deliberately use the word "deviation" rather than " drop" because I believe that significant deviations from the plan in either direction are caused by a mistake in analysis and planning. The only difference is that the client is happy when there is a positive deviation and sad when there is a negative deviation. As for me, I am always sad when an analyst meaningfully deviates from the plan.
Retrospective is a great tool to evaluate one's qualifications and gain experience when you realize the difference between "the data revealed XXX" and "it actually turned out to be NNN".
Different Perspectives on Analytics
Let's analyze how the customer perceives analytics:
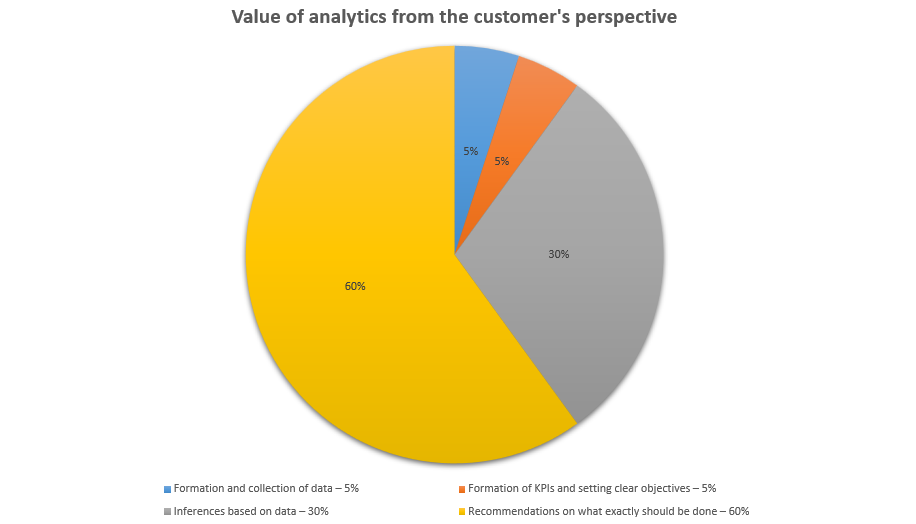
Roughly speaking, customers only care about recommendations and terms of reference for changes, it is where they see the key complexity and identify these steps as the main ones.
It happens because the market of data providing is quite developed – there are different kinds of databases, including Google Analytics, CRM, cloud data and Big Data – all of them cost relatively little money, while the reports can be captured and aggregated almost instantly and automatically. However, some guys are trying to monetize this work as well, calling data collection analytics.
Meanwhile, for the analyst, all the stages are equal in terms of workload and strongly depend on each other – it is incorrect to call analytics separate sections. For example, when the report contains mere data sets, the person who generated it shifts the work of drawing conclusions and making recommendations to the reader.
In order to come up with recommendations and specific terms of reference for changing something, you should spend a large amount of time working on each stage.
A series of analytical reports can become the new standard and vision for a business. For example, if you need to understand the key reasons for customer churn, an analyst considers current data, analyzes cause-and-effect relationships, and finally you get a report that can be generated systematically, seeing business KPIs from a new angle.
Overcoming Cognitive Bias
Those who have read Daniel Kahneman know that people are captivated by their beliefs and misconceptions. Analysts need to figure things out on a regular basis, so this is a task I let the specialists do in pairs. For those who haven't read the book, I'll summarize the bias that regularly hits the analyst.
It is what you see (jumping to conclusions)
Collecting data step by step, the analyst builds up a picture of which he is firmly convinced. So, he is tempted to stop researching, as "everything is already clear". If you don't have enough data, someone having it may doubt your conclusions – you will stick to your inferences simply because you don't have the full picture of the data to draw the right conclusions.
Priming
Effects of personal experience or associations on the analysis. In our case, when the question is initially formulated with an estimate. For example, in the briefing, the client is convinced that the market is growing and the task is set on the basis that this growth will last on its own. The client sells this idea to an analyst and the analyst, being influenced, starts looking for clues as to why the market will grow, even though there is no basis for it.
Remember how we search for information when we are convinced that a disease can be defeated with folk remedies: we search for "how much hot tea should I drink to treat a cold". The original conviction is false, so wrong conclusions are built upon it: the only thing matters is the amount of cups.
Criteria for Good Analysis
Flexibility
An additional goal of the analyst is to collect just the relevant data that significantly affects the problem and answer how much the figure should be changed to achieve the goal. Most commonly, the answer comes down to the resources of the company.
The main problem for the analyst is the lack of complete data. Under such circumstances, they need to be creative and determine how to use the current data to solve the problem.
The hallmark of a good analyst is generating multiple solutions to the same problem, in the context of limited data.
Relevance
The good analysis is guided by business needs. It's not performed because it's interesting or fun. Working with large amounts of data, you can easily get sucked into parsing it for an unclear purpose. A specific business objective is a great start for an analyst.
The business objective is further transformed into sub-objectives, for example, a business objective is transformed into a marketing objective and then into a communication objective. There is no point in analyzing how sensitive different market segments are to the price of a product if its share is only 2% of the turnover.
Statistical significance
The analyst should be able to recognize when a deviation in indicators is significant enough to ring the alarm and urgently correct it. How do we determine this significance? If a parameter deviates more than 10% – I consider it mathematically significant.
I would like to separately note the group studies. The analyst most often focuses on what the majority of the sample thinks, does, and expects, not the entire audience. It’s impossible to please everyone and perfectionism will only increase the budget and time for analysis. Remember, the larger the sample size, the smaller the margin of error and the higher the probability that the "correct" answer is very close to the one found based on the group's research.
Explainability
Your points should be understandable to people who don't necessarily know the technical details. The analyst should be able to present and position his/her outcomes to project sponsors who are no great judge of the technical issues.
The reports that need to be "translated" from the analyst's language into Russian are bad reports.
The Perfect Analyst
A good analytics professional quickly counts in head, understands the business models of the area they work in – this is important for understanding the order of costs for implementing hypotheses and risk analysis. He also easily establishes cause-and-effect relationships between available data, has business acumen, is able to clearly express their thoughts and present results. And they don't exist.

